Incorporating data into the daily newsroom grind can feel overwhelming, especially for smaller publications that may need to train writers on how to use data techniques to expand their reporting.
It’s tempting to wait for a large enterprise piece to begin using data in new ways, but starting data work on a smaller scale can greatly improve day-to-day coverage of existing beats, and help reporters to get used to working with data before bigger projects come around.

Dan Keating
As smaller publications weigh getting into the data game, starting with small beats is better than not starting at all.
“The important realization is that a reporter standing there with paper and a pencil is at such a ridiculous disadvantage (as compared to electronic data),” says Dan Keating, a data analysis reporter at The Washington Post. We talked to Keating about what types of stories small publications are doing wrong if they aren’t using data — and what data stories newsrooms should skip when they’re short on time or manpower.
Crime stories
Most local newsrooms cover crime daily, but the typical crime story focuses on one incident at a time, or draws conclusions from anecdotes rather than evidence.
“It drives me crazy when we do crime stories that say, ‘Police are seeing an increase in robberies,’ with no data or a map,” Keating says. “Putting data into these stories can make it infinitely more insightful.”
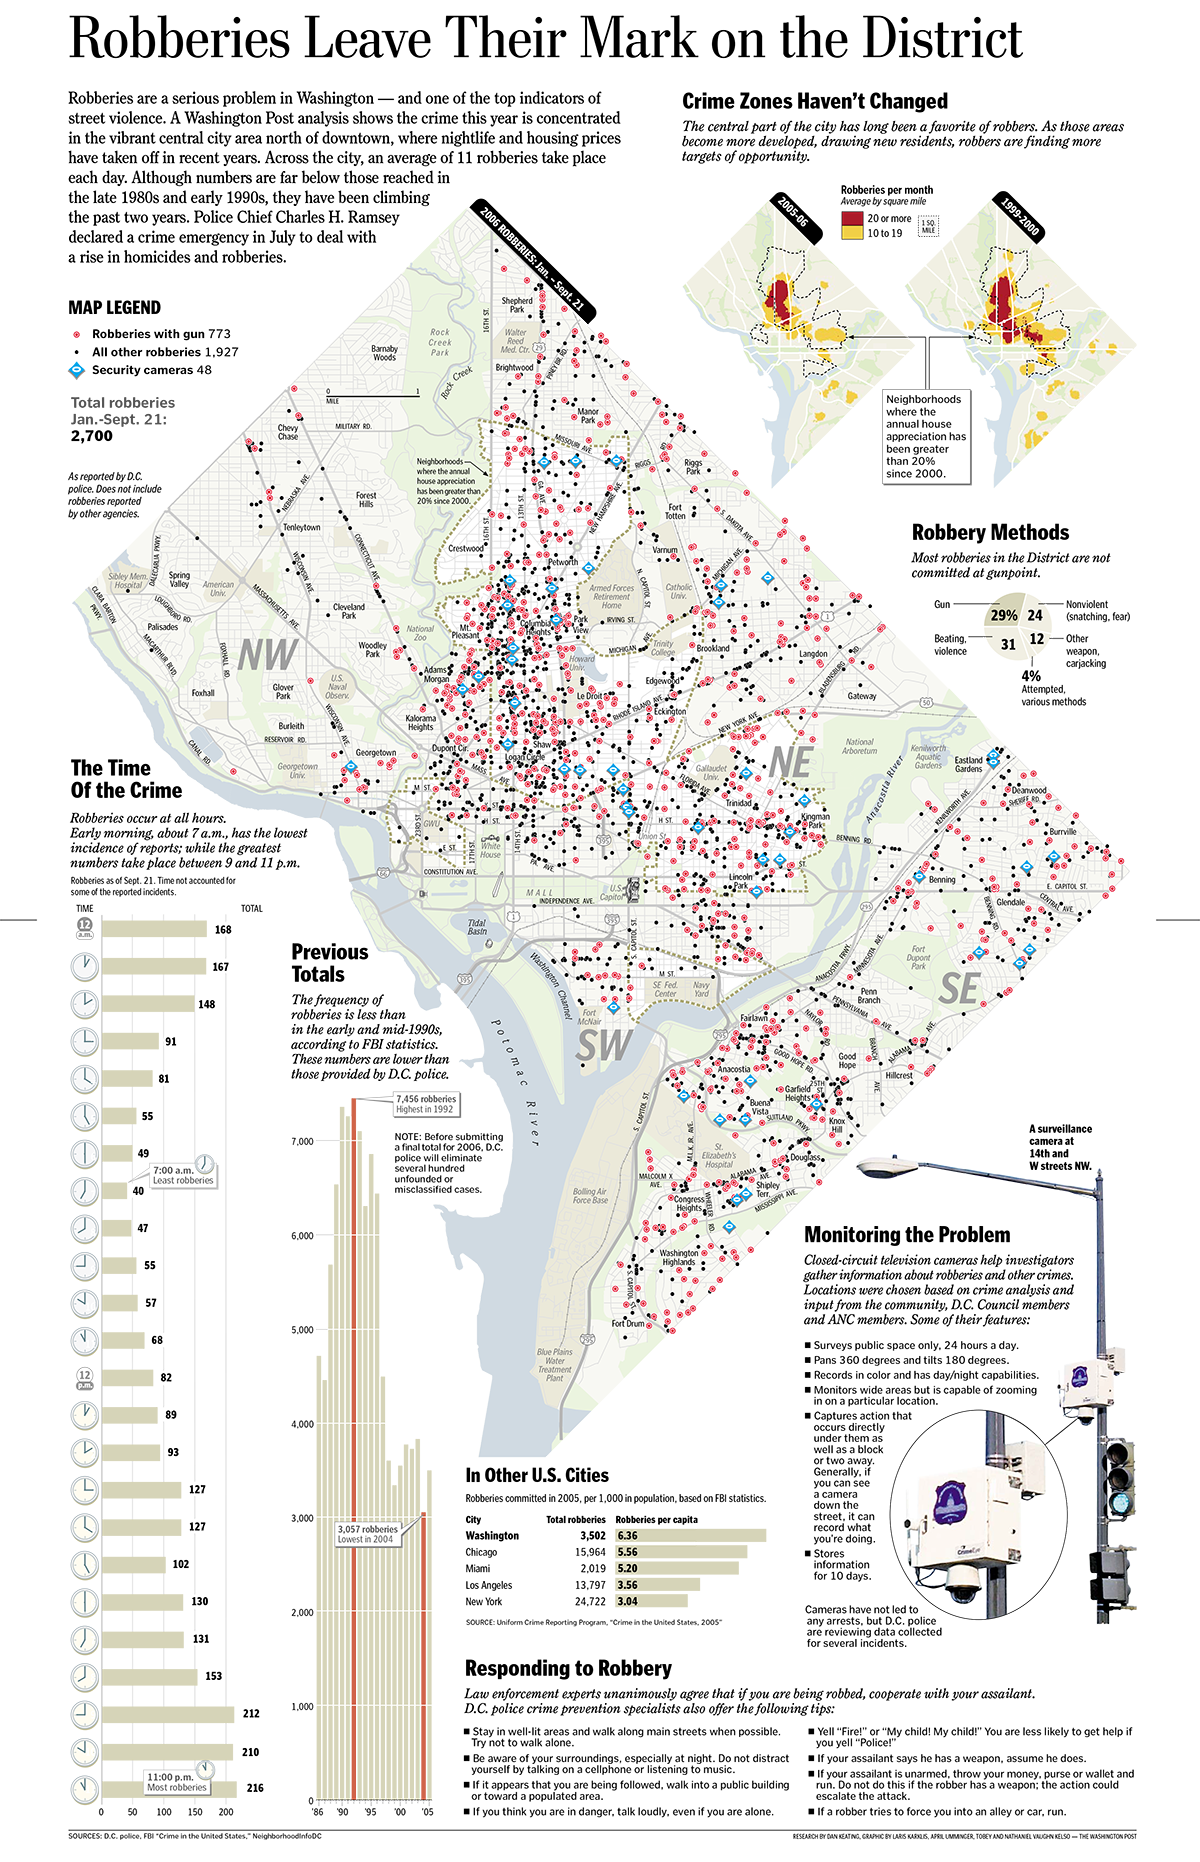
The Washington Post mapped robberies across the city, bringing personalization to an otherwise data-heavy story.
Police departments typically keep data electronically, and many include links to download portions of it on their websites, Keating says. FBI Uniform Crime Reports are also an easy place to start, and can lead to ideas of additional data sets to request from local departments. There are inherent challenges to working with crime data, including underreporting by citizens, inconsistent tracking by police, and misclassification of crimes. It is important to pair data with both anecdotes and deep understanding of your community in order to identify any inconsistencies in the data that may become stories themselves.
These data sets should include basic counts of different offense types per month or year, and ideally several time periods will be online in the same format for easy comparisons. If the department doesn’t release its data as a spreadsheet, free browser plugins such as Tabula can break most PDFs into Microsoft Excel-compatible files.
In addition to crunching the numbers, Keating suggests experimenting with maps as a way to help readers see crime data in a new light. At the Washington Post, reporters mapped every robbery that took place in the city over several years. Mapping data and allowing users to search for their neighborhood takes extra time, but it also brings a sense of personalization to stories that a string of facts in a paragraph can’t create.
Stories about test scores
In the coverage of local schools, test-score data can be a great place to start bringing a new approach to educational reporting, Keating says.
The No Child Left Behind Act mandated that all schools release the results of state assessments broken down by grade, race, disability status and students whose first language is not English. Analyzing scores by category instead of just using the average or median can show a completely different story, especially if the data points to groups that don’t benefit equally from state programs.

The Tampa Bay Times matched test score data to demographic data to tell the story of how resegregation affected Pinellas County schools.
Contrasting test score data with demographic data for schools with the schools’ budgets can lead to powerful pieces on educational funding and the opportunities it provides. In particular, several years of test score data can identify schools that have experienced extreme score changes, either positive or negative, and economic and demographic data can identify social factors that may contribute to or against a school’s success.
It can be instinctive to use data analysis to identify averages or ranges, but the often the most impactful stories come from identifying and explaining outliers. In August 2015, the Tampa Bay Times used test score data from Florida schools to examine the drastic effects of resegregation in Pinellas County elementary schools. The paper’s investigative team was able to match changing demographic data with plummeting assessment scores, and link the changes to specific public officials and policies.
Tax stories
An unsung hero in data reporting, tax stories can be a great place to do entry-level data analysis in Excel and produce stories that hit above their weight class. Bringing data into the equation can “turn all those piles of tax increase stories into something that’s actually useful,” Keating says.
Before coming to The Washington Post, Keating and his coworkers at The Miami Herald covered a set of tax increases by taking the average price of a home in their assigned county and breaking down exactly how much of that value residents would pay to each tax category due to the increases. At the Post, reporters did a similar story that broke down an individual’s contributions to each of the major federal budget categories.
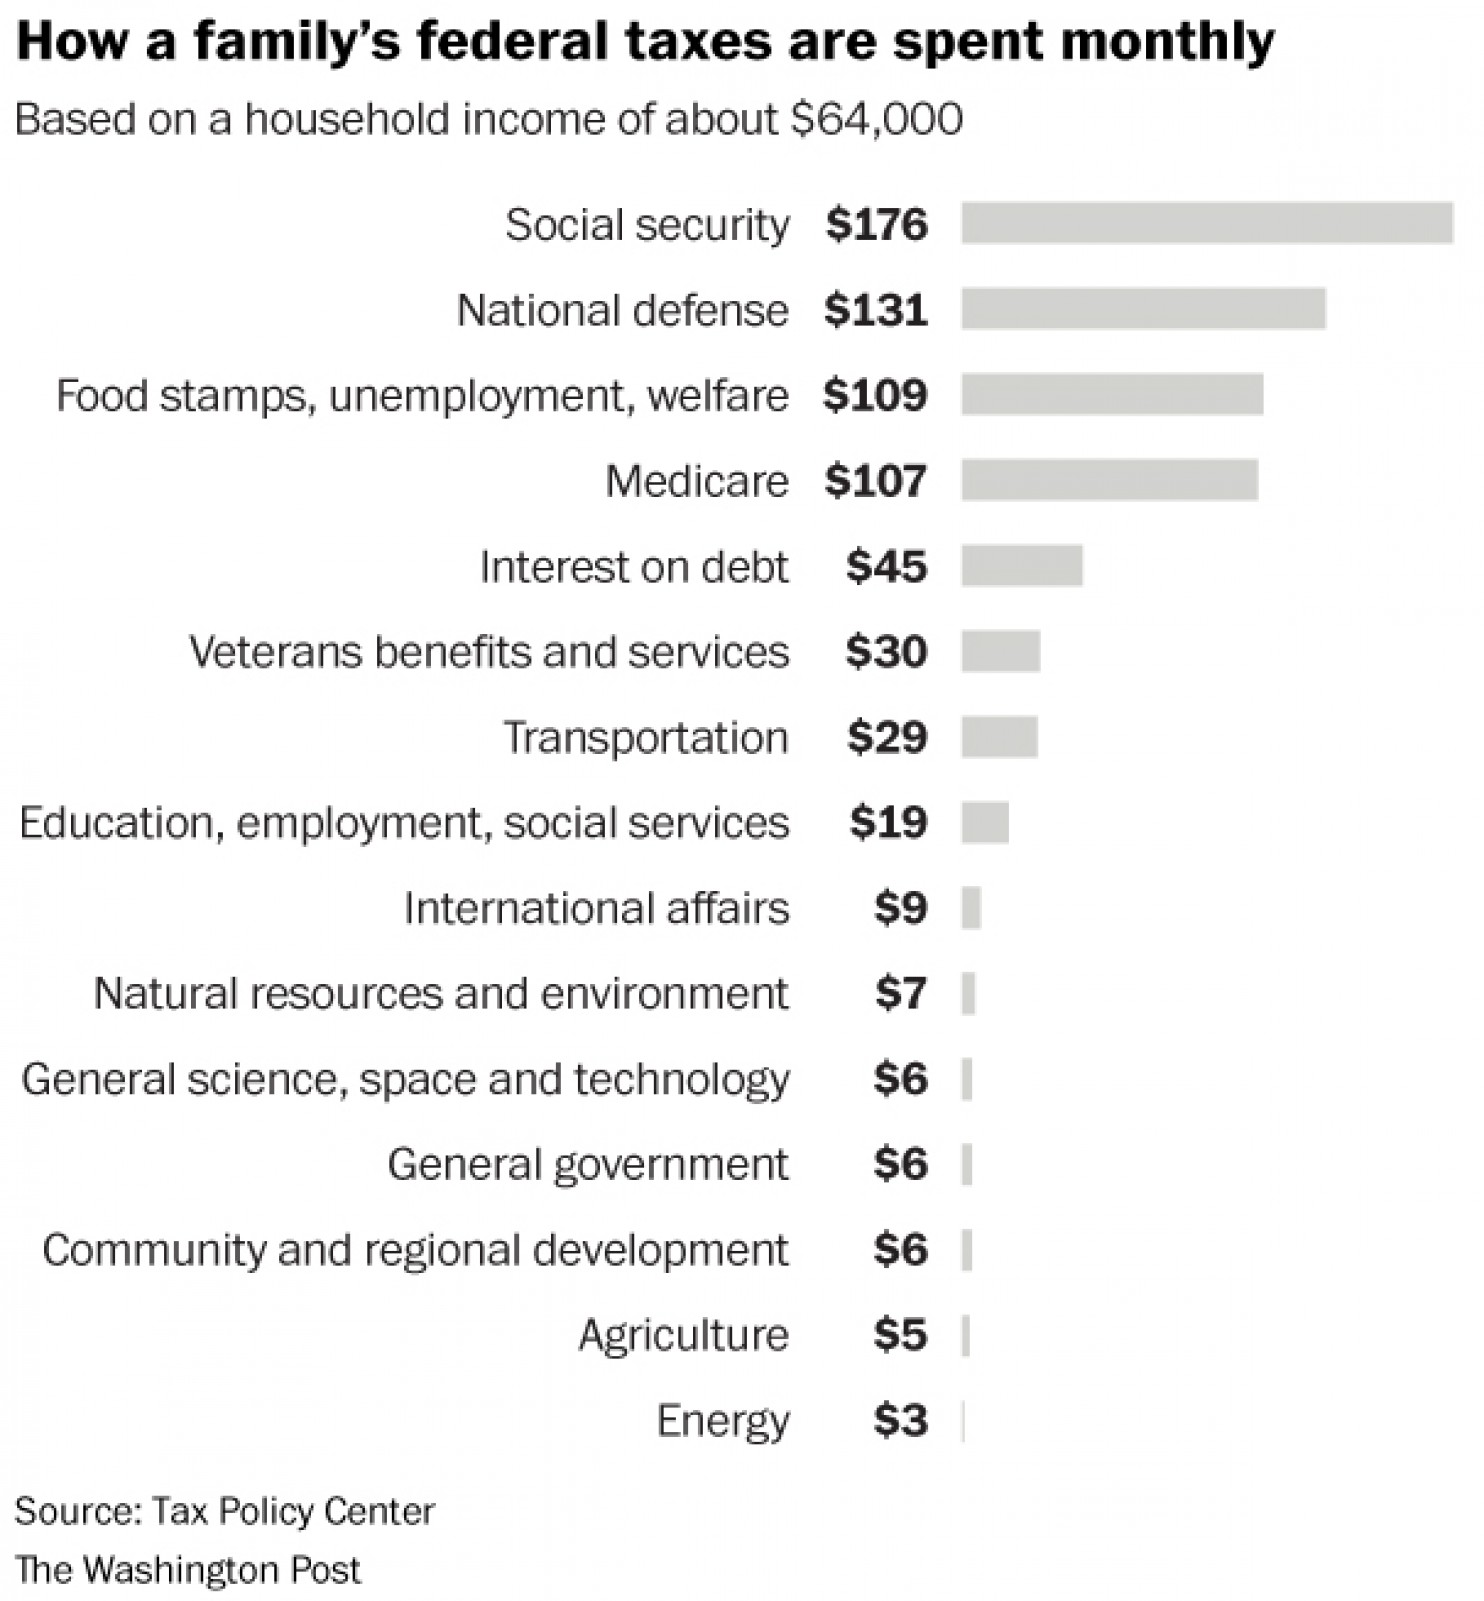
The Washington Post broke down an individual’s tax contributions to major federal budget categories, turning a tax story into “something that’s actually useful.”
All tax-increase data should be readily and easily available as part of budget data, which can be downloaded from any government website. With just a few basic calculations in Excel or Google Sheets, tax data can be personalized, meaningful and more impactful than before.
Many newsrooms cover tax increases as part of budget stories, but Keating warns that a majority of local budgets don’t deserve the same data treatment as their tax-story counterparts. The same can be true for most data sets with six or fewer numbers. While budgets lend themselves to interesting data visualizations such as the classic bar or pie chart, little work is needed to bring out the meaning behind the numbers. In most cases, spreadsheets won’t provide much more information than quality interviews, Keating says.
The popular beat for your publication
While the suggestions above are a good place to start for any publication, some of the best ideas for data stories will come from beats that are already popular with your audience. In rapidly expanding regions such as the Southwest, this could mean requesting building permits or zoning data for a long-term look at development trends. For other areas, some stories may come out of unique environmental concerns such as fracking, blasting bedrock or natural disasters, Keating says.
Sports stories often make great data stories, especially for beat reporters with a deep knowledge of one team, although reporters may need to compile their own data on teams to get a unique take on the numbers. Using Google to find statistics doesn’t count as data reporting, Keating says, but reporters and editors who are willing to put in the extra effort will be rewarded with engaging, insightful stories that set them apart from their competition.
For more, check out API’s new Strategy Study: “Diving into Data Journalism: Strategies for getting started or going deeper”
You might also be interested in:
News leaders who say they want their journalism to help people make decisions and thrive must help their community maintain a sustainable relationship with civic information, which is very different from a newsroom that aims to get people to consume more information.
To understand what’s working and what challenges newsrooms continue to face, API spoke to people from The Boston Globe, The Texas Tribune, the Minnesota Star Tribune and The Seattle Times about their strategies around subscriptions and membership.
We gathered news leaders and non-news experts to discuss what it looks like to build sustainable youth engagement efforts into their coverage and fundraising. We asked four summit participants to share more about the ways they are funding experiments with youth engagement in their communities.

