As newsrooms across the country strive to serve their communities during the public health crisis, it’s even more important they know what in their coverage connects with their audiences.
In response, the American Press Institute created a special dashboard in our analytics tool Metrics for News to help newsrooms assess the impact of their COVID-19 coverage. Now we want to make that dashboard available for free to as many newsrooms as we can.
For the next four months at least, a limited version of Metrics for News with access to the Coronavirus Dashboard will be available for free with support from API’s team for up to 20 selected newsrooms. If we are able to, we will expand that number. Please click here to apply by Friday March 27, 2020.
All existing Metrics for News partners will also have access to this Coronavirus Dashboard, plus the many other advanced features that help with deeper data analysis.
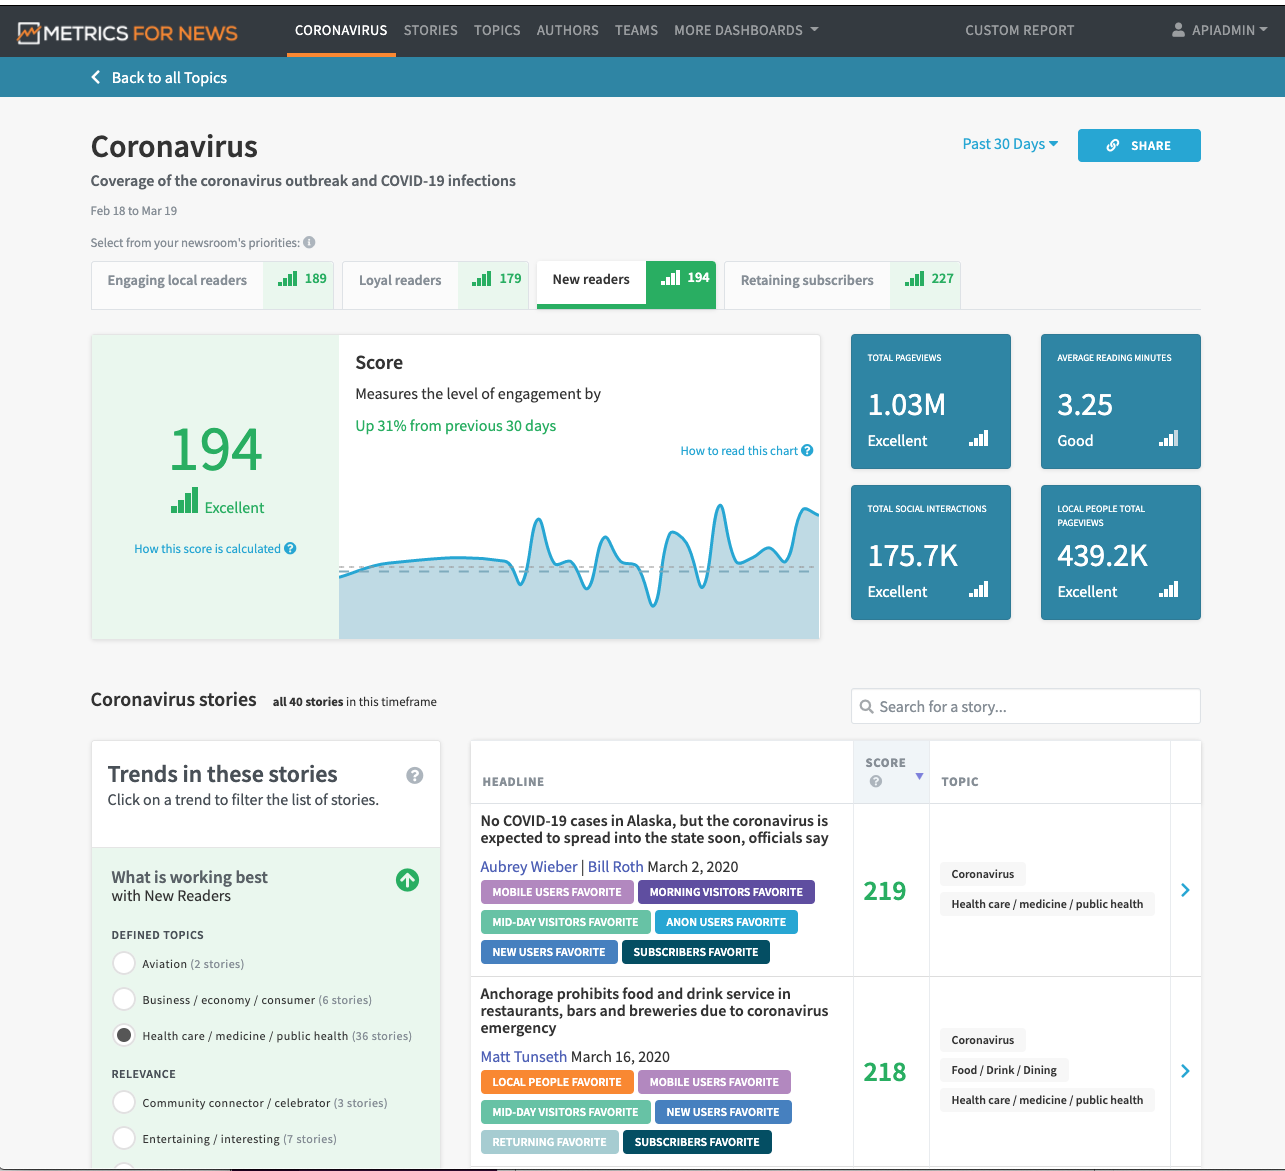
This dashboard allows newsrooms to automatically track all their coverage of the novel coronavirus (even if it’s already been published) to learn what’s working with their audiences and what’s not. When resources are stretched and people are stressed, this type of data can help newsrooms make better coverage decisions about the crisis.
Some example questions this dashboard can help you answer:
- Which of your stories about the coronavirus coverage are connecting most with the community, including new readers?
- How does your coverage of COVID-19 intersect with other topics you cover? For example, are COVID-19 stories also about public safety driving more engagement than COVID-19 stories also about local businesses?
- Is your service journalism about public safety and COVID-19 engaging certain audiences and not others?
Metrics for News is a rich tool that moves analytics well beyond page views. The web-based application was developed in response to questions from publishers asking for more empirical ways to make editorial decisions about what to cover and how to cover it. In the five years since, we’ve learned a lot about how newsrooms want to use analytics and how to make it a tool rather than a weapon. Our dashboards are designed for specific newsroom roles — from staffer to senior manager — to simplify analytics, automate insights and answer important audience questions.
As you work to serve your readers, know that we are here to serve you however we can. If there is anything we can do, please let us know. You can reach us anytime at team@metricsfornews.com.
**Live demo: On Wednesday, March 25, at noon EST, the Metrics for News team will conduct a live demo of the Coronavirus Dashboard and answer your questions about how your newsroom can make the best use of it. View the webinar recording here.
You might also be interested in:
Successfully and efficiently marketing your work can be hard, especially for local news teams with limited resources, but marketing yourself to your audience is an essential skill for news organizations to drive revenue and promote sustainability.
As news teams begin thinking about their election coverage plans, it may feel like adding more tasks to an already full plate, with a fraction of the staff and resources they once had. But that doesn’t have to mean figuring out how to do more with less — maybe it’s doing less with less.
We reached out to Danielle Coffey, the CEO of American Press Institute’s parent corporation, the News/Media Alliance, to learn more about the legal fight for news organizations’ rights with AI.

